
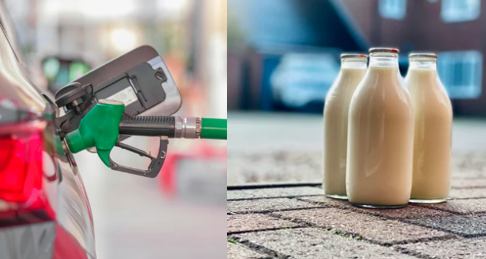
What emits more carbon dioxide - a litre of Milk or a litre of Petrol?
This is not a “which is better” article, or a guide to reducing our carbon footprint, rather a reminder that everything we use has a cost in terms of carbon dioxide produced. Nothing is free of that cost, and we should all understand the effect of what we do.
My first thought when I was looking into this was “don’t be silly” petrol is a hydrocarbon, it’s oil, a fuel, it must have a miles bigger carbon footprint than milk.
Well, let’s see …
So, how do we measure?
And this is a real apples and oranges moment, I can’t pretend this is particularly rigorous, but I hope it is interesting.
The unit used is carbon dioxide equivalent (CO2e). Different gases are emitted when making and using milk and petrol, mostly CO2, but also oxides of nitrogen and methane. These have different global warming potentials, for example 1 kg of methane does as much global warming as 80kg of CO2 over 20 years, but as it disappears faster than CO2 that is 30 times over 100 years. So to make sense of this everything is bought down to carbon dioxide equivalents, CO2e.
So that we get all the contributions we have to look at the lifetime of the material - how much CO2 is involved in creating it as well as how much is involved in using it
Let’s start with petrol …
It is pretty straightforward. We use some energy in getting crude oil out of the ground and refining it to produce petrol. That takes around 0.58kg CO2e/litre (Note 1). Biofuels are slightly different, but as there is little in each litre (5-10%) it does not make much difference at this level of calculation.
Then we liberate CO2 when we burn petrol in an engine. As petrol is all hydrocarbon this is the biggest portion at 2.09kg CO2e/litre (Note 2). So a total of about 2.67 kgCO2e for every litre of petrol used. Fuel use in transport is 29% of UK total emissions - so you can see why decarbonisation of transport is important
Now let’s look at milk, which is more complicated …
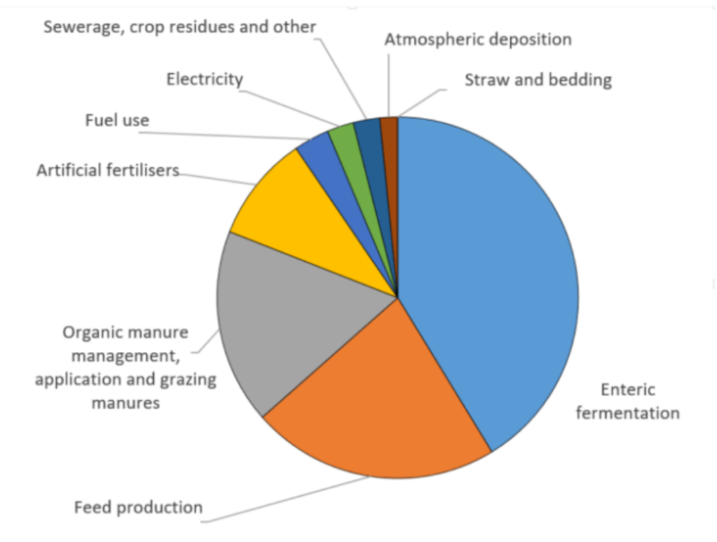
The emissions related to milk production come from enteric fermentation (cows exhale fart and burp methane as a result of enzyme processes in the ruminants digestive system) as well as from production of feed and from manure.
The contributions to typical a UK farm’s emissions are shown in the pie chart (Note 3)
How much each of these factors make up the total depends on the management of the cows – are they wintered inside as in UK/Europe? what feed they are given and how efficient are they at producing milk?
So there is a big variation depending on where your milk comes from. For example milk from Tanzania has an embedded carbon of 5.99 kgCO2e/litre and UK has 0.9 kgCO2e/litre, with the best being New Zealand at 0.7 kg CO2e/litre. All European countries have a figure less than 2kg/litre, about equivalent to petrol, but some only just (Note 4). So let’s take UK at 0.9 kgCO2e/litre.
After milk has been produced it is used, i.e. drunken by us and turned into energy and CO2.
Milk is about 87% water, the rest is fats and protein and minerals. The carbon in milk is about 0.06 kg/litre, which when burned (i.e. drunken) makes 0.2 kgCO2e.
So we can estimate that in the UK the embedded carbon in 1 litre of milk is 1.1 kgCO2e/litre. (But if your milk comes from a less efficient system it can be more than 6kg).
So what is the conclusion?
There is more embedded carbon in petrol than milk (in the UK anyway).
But it is not nothing in milk and it can actually be more than petrol depending on where you are.
Notes: Data reference sources …
1. Greenhouse Gas Reporting: Conversion factors 2023 -gov.uk
2. DEFRA GHG reporting factors for companies
3. https://adas.co.uk/news/reducing-the-carbon-footprint-of-milk/
4. Mazetti, Falconer & Ledgard J Dairy Sci 105(12) Dec 2022 9713-9725